The new paper by Siewert et al. shows that subsurface soil properties in permafrost tundra terrain exhibit tremendous spatial variability. They describe the subsurface variability of soil organic carbon (SOC) and ground ice content from the centimeter to the landscape scale in three typical tundra terrain types common across the Arctic region.
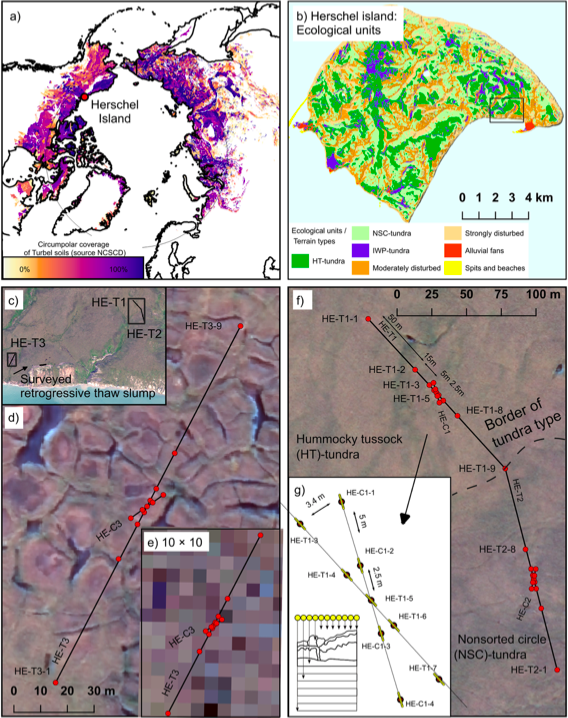
Figure (1) shows a) the Circumpolar distribution of Turbel soils (Source: Northern Circumpolar Soil Carbon Database, Hugelius, et al., 2013; Tarnocai et al., 2009) and the location of the study area. (b) A map of Herschel Island with colour-coded ecological unit (Source: Obu et al, 2015), (c) the location of the transects and the surveyed retrogressive thaw slump, (d) the location of the transects for the ice wedge polygon tundra (IWP tundra) showing small-scale late Holocene ice wedges (e) the IWP tundra at a reduced resolution of 10 × 10 m to reflect the enhancement and potential of very high resolution satellite imagery, (f) the transect layout for hummocky tussock upland tundra (HT tundra; top) and nonsorted circles on upland tundra (NSC tundra; bottom). Both images are from a high-resolution satellite image, (g) the construction of subpedons from 1 m soil pits to calculate spatial autocorrelation. IWP, ice wedge polygon.
To investigate the tundra terrain types a soil sampling scheme was designed (see figure 2) to analyse the spatial variability of soil properties on three of the local ecological units.
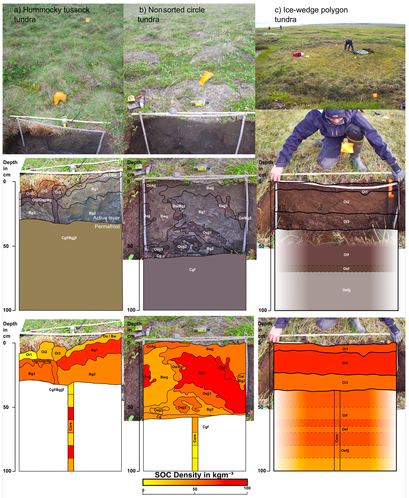
Top of Figure 2: The three typical tundra terrain types analyzed in this study. (a) Hummocky tussock (HT)‐tundra (HE‐C1‐4), (b) Nonsorted circle (NSC)‐tundra) (HE‐T2‐2) and (c) Ice‐wedge polygon (IWP)‐tundra (HE‐T3‐05). Middle: Soil horizon distribution for typical profiles. Bottom: Corresponding soil organic carbon densities in (kg C−3) per soil horizon below. The HT‐ and NSC‐tundra showed highly disturbed soil profiles, while the IWP‐tundra showed homogenous layering of organic rich peat horizons. For deep soil layers in the permafrost section only information from the core is available. For (c), the uncertainty is lower, as we can expect underlying layered lake sediments.
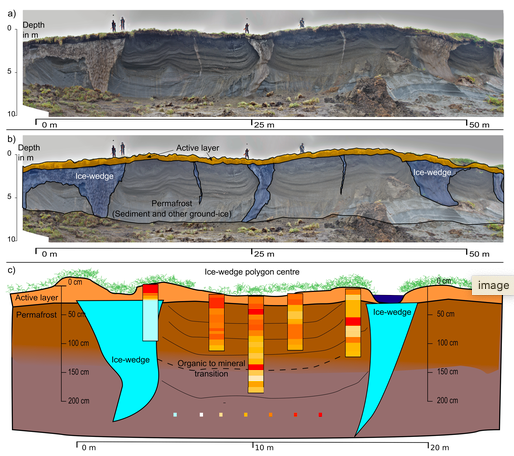
3a) shows the headwall of a retrogressive thaw slump cutting into upland tundra terrain representative of HT‐ and NSC‐tundra (person for scale). (b) Digitized overlay of the active layer (orange), ice‐wedges (blue) and the remaining permafrost (white). The ice‐wedge to the left was likely a crosscut through a connection point of several ice‐wedges. The ice‐wedge in the center had a width of 3 m, the large ice‐wedge to right had a width of 7 m. The smaller ice‐wedge in between had a width of 0.5 m. (c) Schematic profile across the center of the IWP‐tundra transect (cf. Figure 2c top). Soil profiles show the SOC density with depth for individual samples The organic material to mineral transition was reached for the central profile at a depth of 130 cm. Note the difference in scale for the x‐ and y‐axis. IWP, ice‐wedge polygon; SOC, soil organic carbon.
For more information find the whole study here: https://agupubs.onlinelibrary.wiley.com/doi/10.1029/2020GB006659