Click the Image to download the Arctic Permafrost Atlas in PDF.

What is it?
The Arctic Permafrost Atlas is a key outcome of the Nunataryuk project. Edited by GRID-Arendal together with all Nunataryuk project partners, it will present state-of-the-art knowledge about permafrost and the impacts of permafrost thaw on human communities in the Arctic.
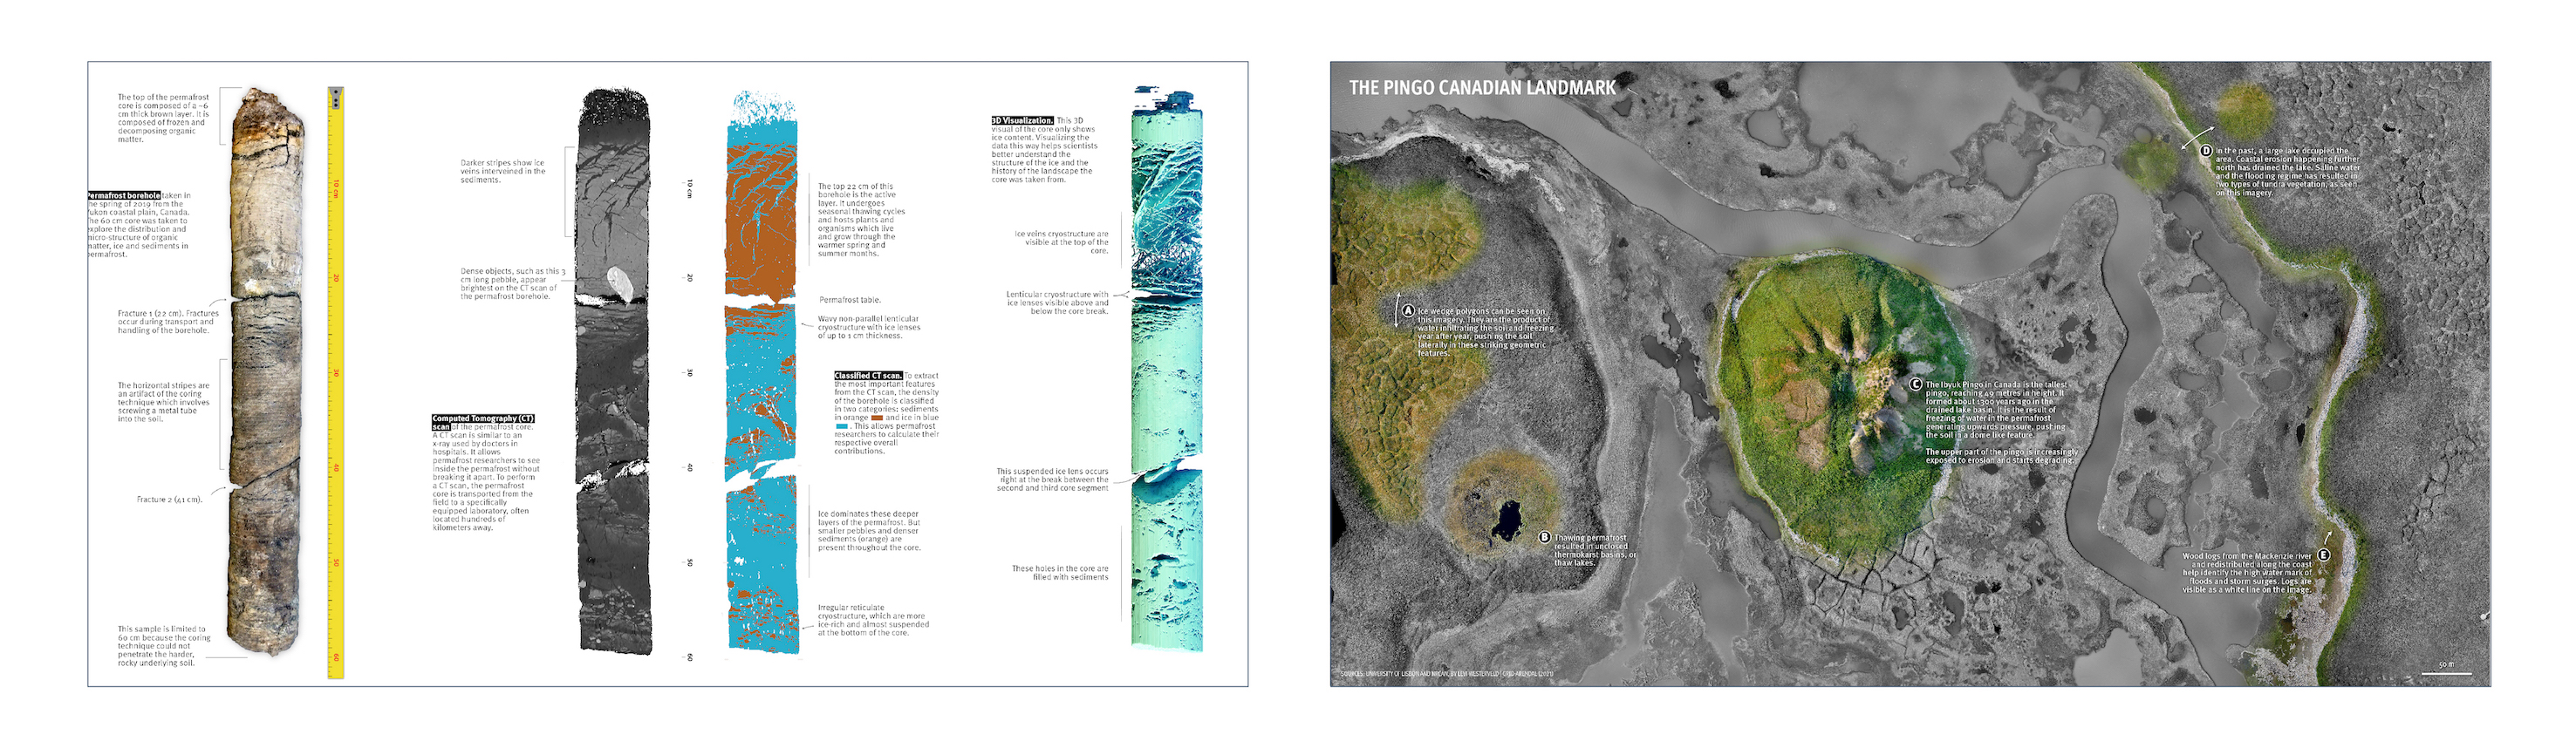
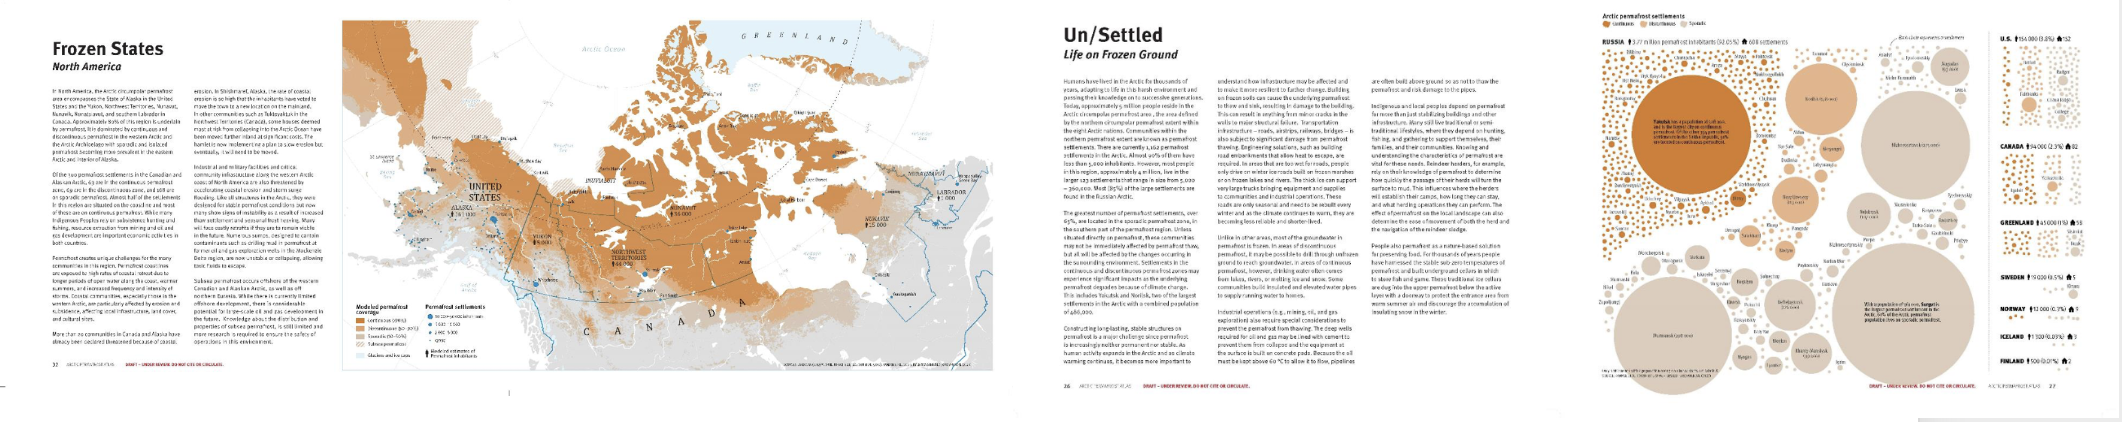
The print and digital atlas is a highly visual product. It comprises of 156 pages divided into 7 chapters with 82 unique maps, several illustrations, drone imagery and photographs.
155 scientists have contributed to the Atlas with data, feedback, review and comments and it is truly a collaborative effort.
As an interdisciplinary publication, it will both focus on the nature sciences of permafrost, but also the Arctic communities and people whose lives revolve around permafrost and explore strategies they can use to adapt to permafrost thaw.
How was it made?
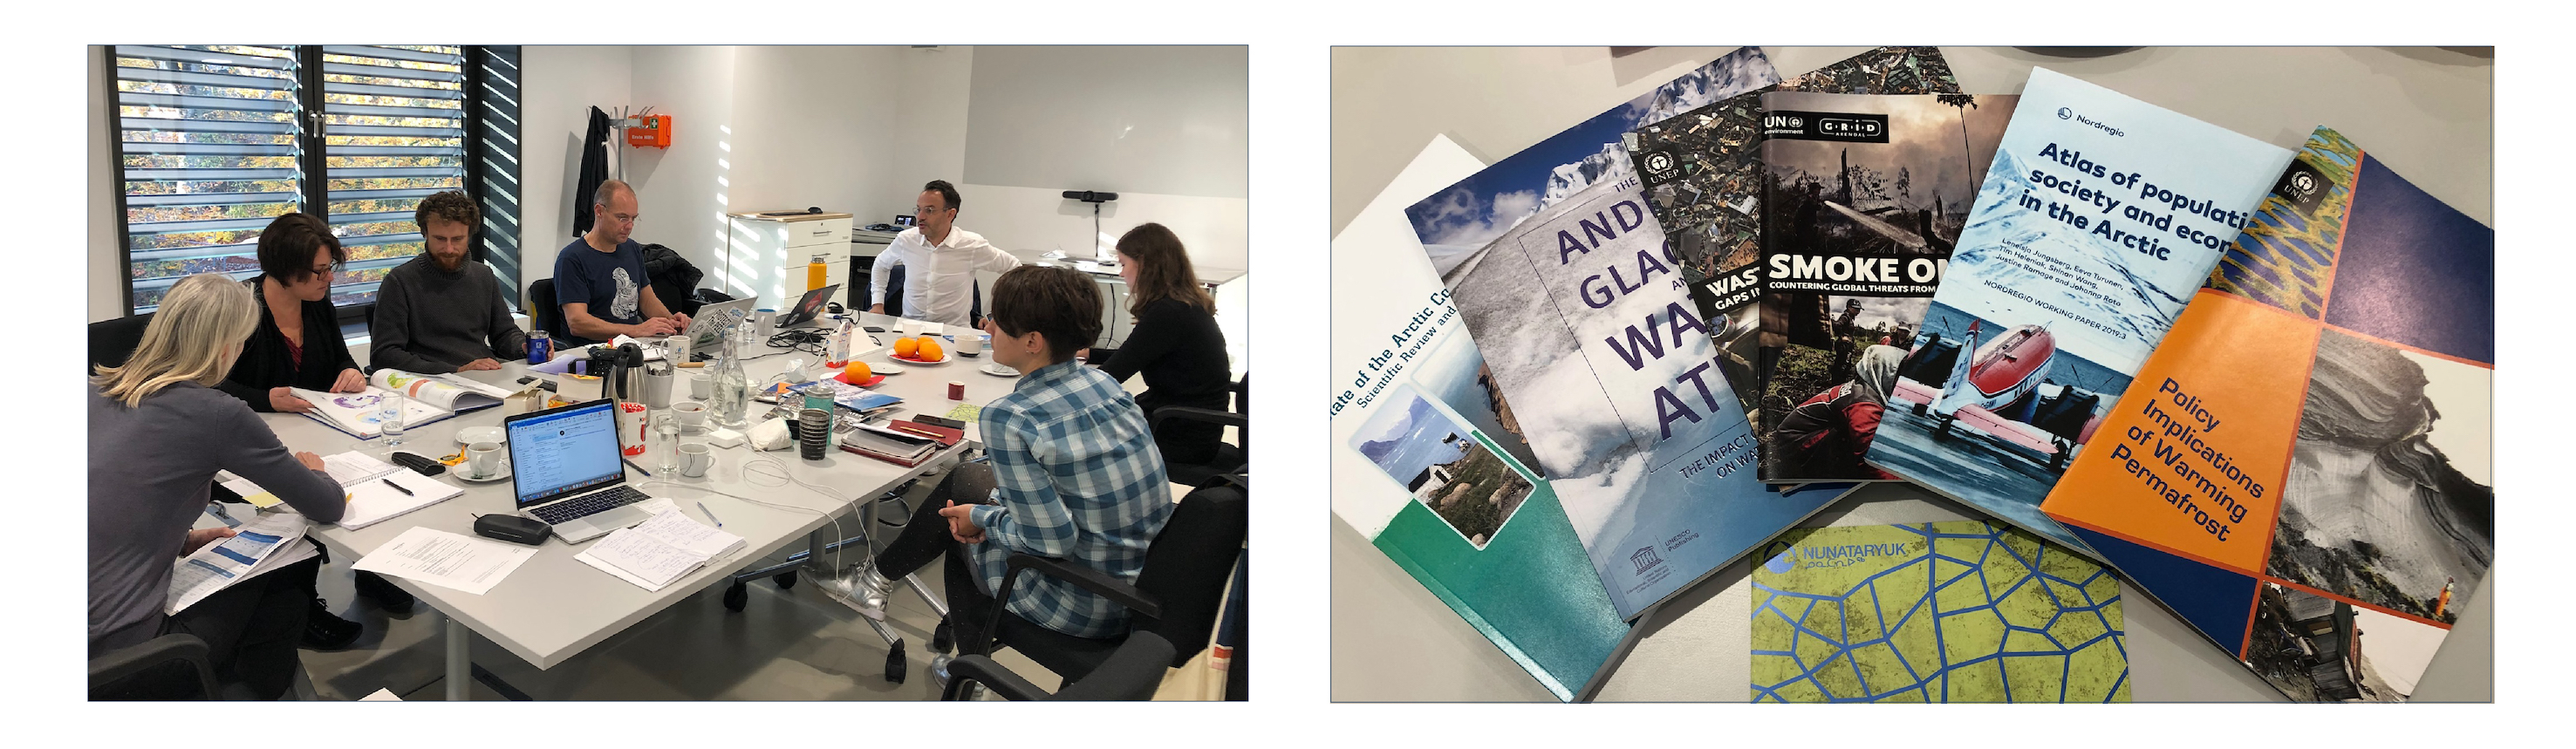
The work on the Arctic Permafrost Atlas started back in 2019, when the GRID-Arendal PI Tina Schoolmeester together with Runa Lindebjerg and Lisa Hymas visited the Nunataryuk coordinating partner AWI in Potsdam. This first workshop determined the direction the new atlas should take based on the already existing publications and set a preliminary timeline for the production.
After the ground had been laid, the atlas was handed over to Levi Westerveld, who has been developing the concept since then and is the editor of the Arctic Permaforst Atlas. Levi is a cartographer by education and has worked at GRID Arendal in various science visualization projects.
After the table of content of the atlas was drafted, a first task was to find out all the latest data available for each topic covered in the publication. This scoping work was supposed to take place in breakout sessions during our annual meetings, but as the pandemic hit Europe, and the world, in early 2020, we had no other choice than to move online.
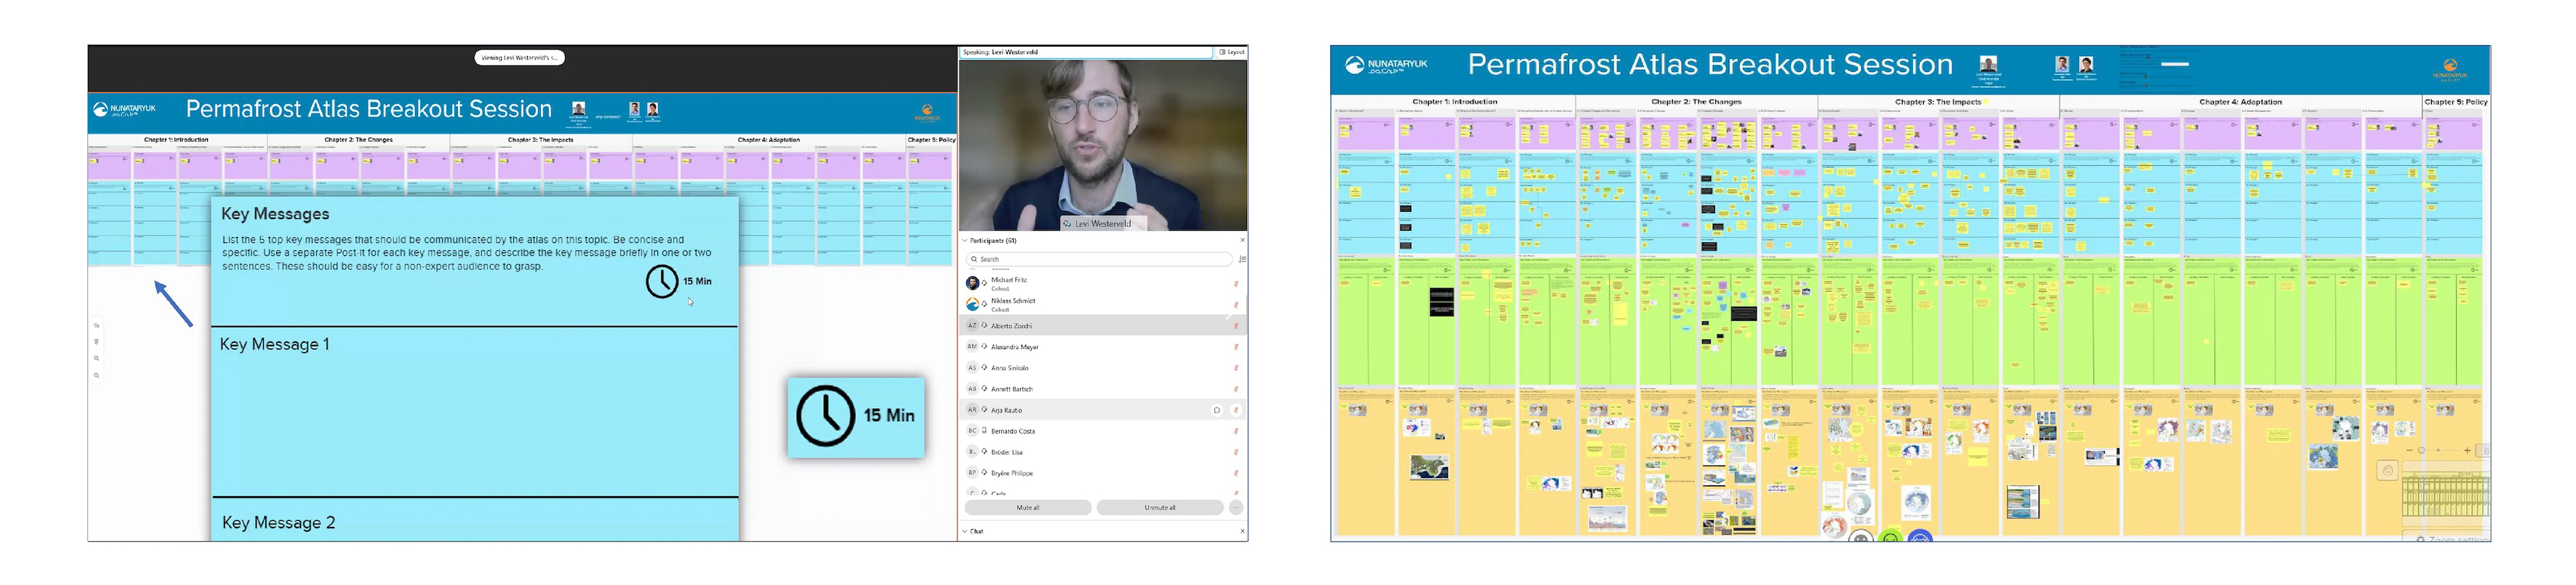
In March 2021, as part of our online annual meeting, GRID-Arendal organized an interactive workshop for all scientists to contribute with ideas, and data, to the table of contents of the atlas. In this online workshop, project scientists were asked to share three types of information on topics that are now covered by chapters in the atlas – for example, the impact of permafrost thaw on Arctic coastlines.
Read here “You are muted” How researchers across the world came together digitally to share knowledge about permafrost. A story about the Nunataryuk Arctic Permafrost Atlas interactive workshop.
The online workshop was held in Mural, an online platform that allows users to add post-its, images, and text in a virtual panel. In less than 45 minutes, the enthusiastic and knowledgeable Nunataryuk researchers made over 640 individual contributions. These included post-its with text and screenshots of maps and datasets.
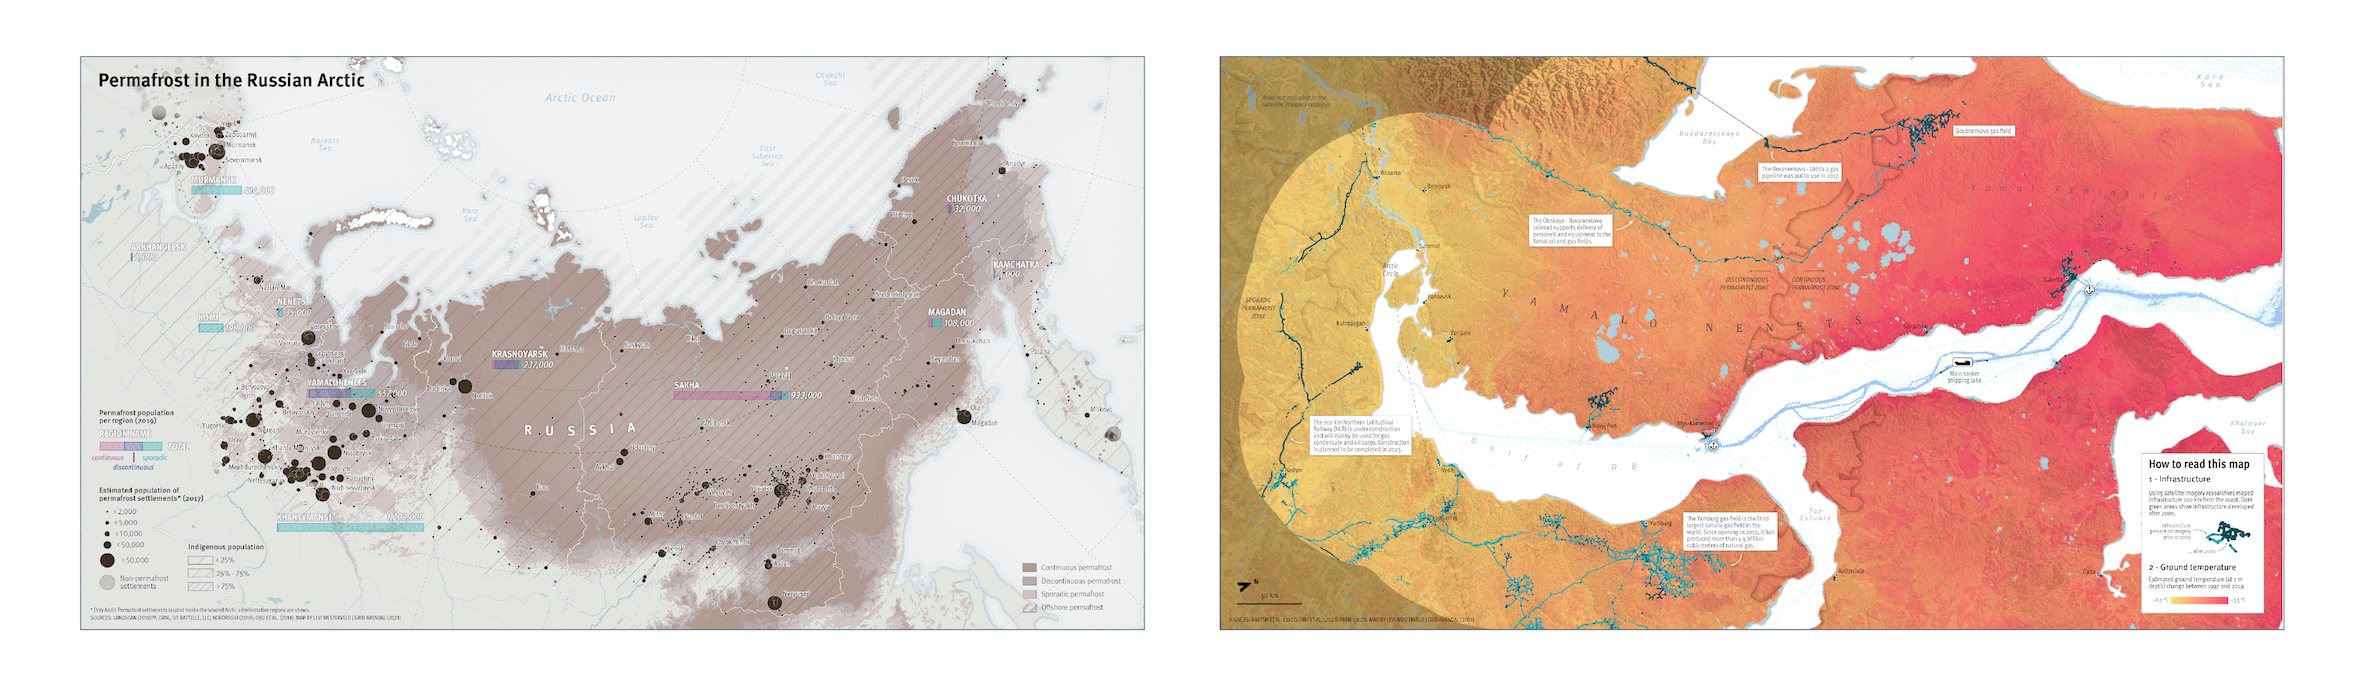
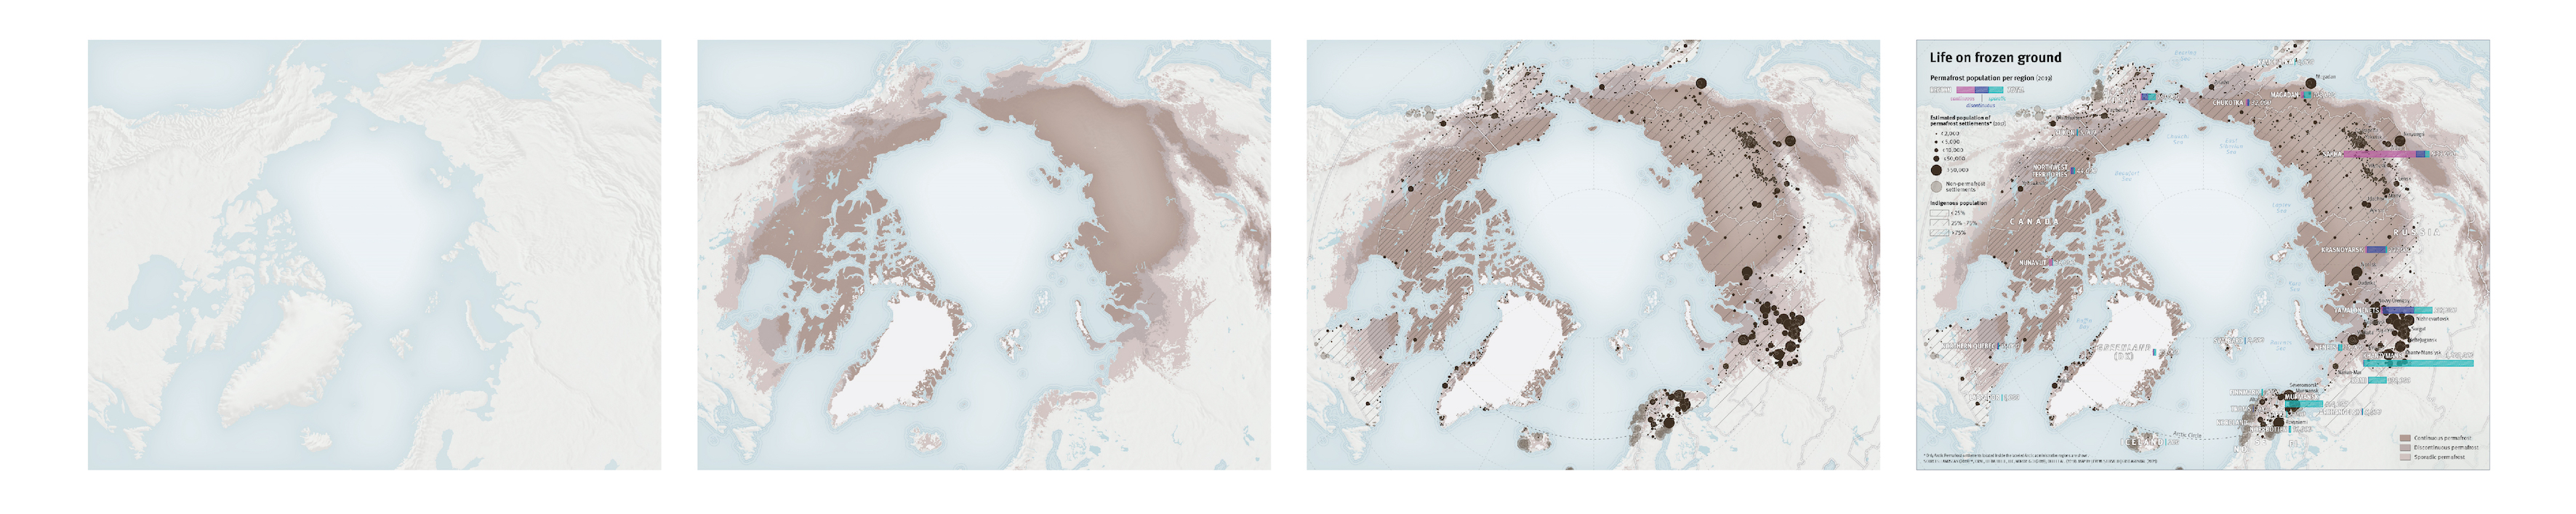
When the table of contents was ready, it was time to move on and start the visual design of the atlas. Maps are perfect for visualizing environmental variables such as snow cover distribution, temperature anomalies, or population density. But when it comes to visualizing data pertaining to the social sciences, a lot of work remains to be done to develop the right cartographic language. Take, for example, the ways that coastal erosion from permafrost thaw affects human habitation. How to go about visualizing and trying to communicate the social implications of such a change? Of course, it is possible to map current or projected changes in coastlines, but how to capture in visuals what this means on the ground for communities or their cultural heritage? Some of these challenges will require us to think outside the box and draw inspiration from other leaders in visual communication as we produce this atlas.
Read here "Behind the scenes: Making maps for the first Arctic Permafrost Atlas". A background story how the maps of the Arctic Permafrost Atlas are produced.
In the summer and fall of 2021, all maps and graphics for the introductory chapter of the atlas, and the chapter on permafrost in other areas in the world were drafted. Simultaneously, scientific writers met with permafrost researchers, reviewing literature, and drafting text to go with each section of the publication.
To ensure the highest quality of the design, GRID-Arendal set up an Advisory Board for Cartography and Design. This highly esteemed board includes five cartographers and graphic designers with expertise in the world of map making, publishing, and communicating science and stories to broad audiences.
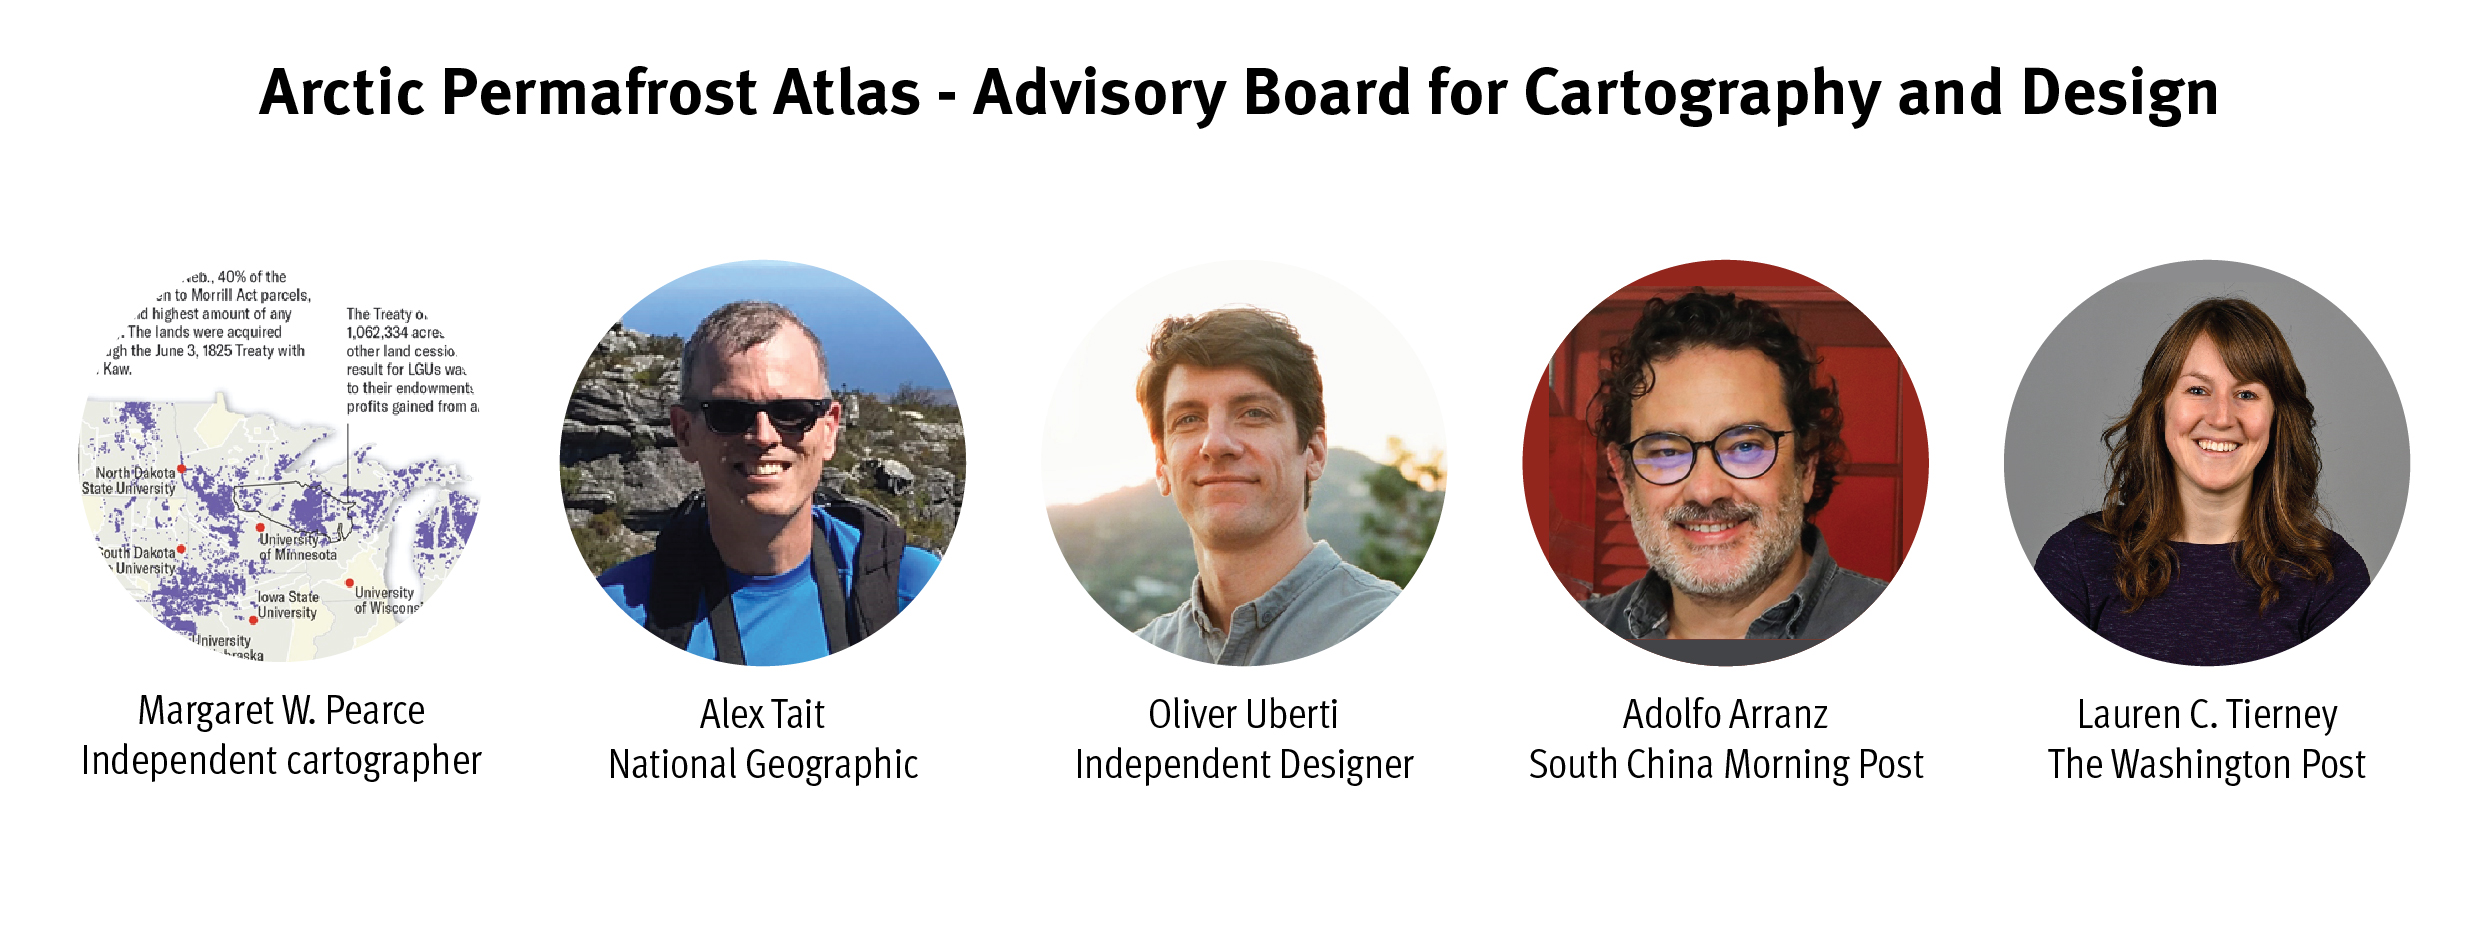
Read here "Behind the scenes of the Arctic Permafrost Atlas: Progress update & the Advisory Board for Cartography and Design". A background story about the talented designers advising on the Arctic Permafrost Atlas.
Read here "You are here! The power of cartography, or how a map is more than "just" a map." A background story on how a map can be so much more than a way to show locations and data. A map can change our perception of events – reshaping our collective memories of those in the past, describe the ones we are living through in the present, or even spur us into action before we reach the hypothetical future.
What it entails?
The Permafrost Atlas is comprised of 156 pages divided into 7 chapters with 82 unique maps and graphics, 50 000 words and 9 portraits.
In total 155 scientists have contributed to the Atlas with data, feedback, review and comments and it is truly a collaborative effort, though the credit for the atlas as it has turned out belongs to the staff at Grid Arendal, specifically, to Tina Schoolmeester, Levi Westerveld and Tiina Kurvits.
Within each chapter a specific topic related to permafrost is introduced. To ease the non-scientific readers into the subject matter each chapter is given a title and a front image that hopefully will give the reader an idea what the text is about.
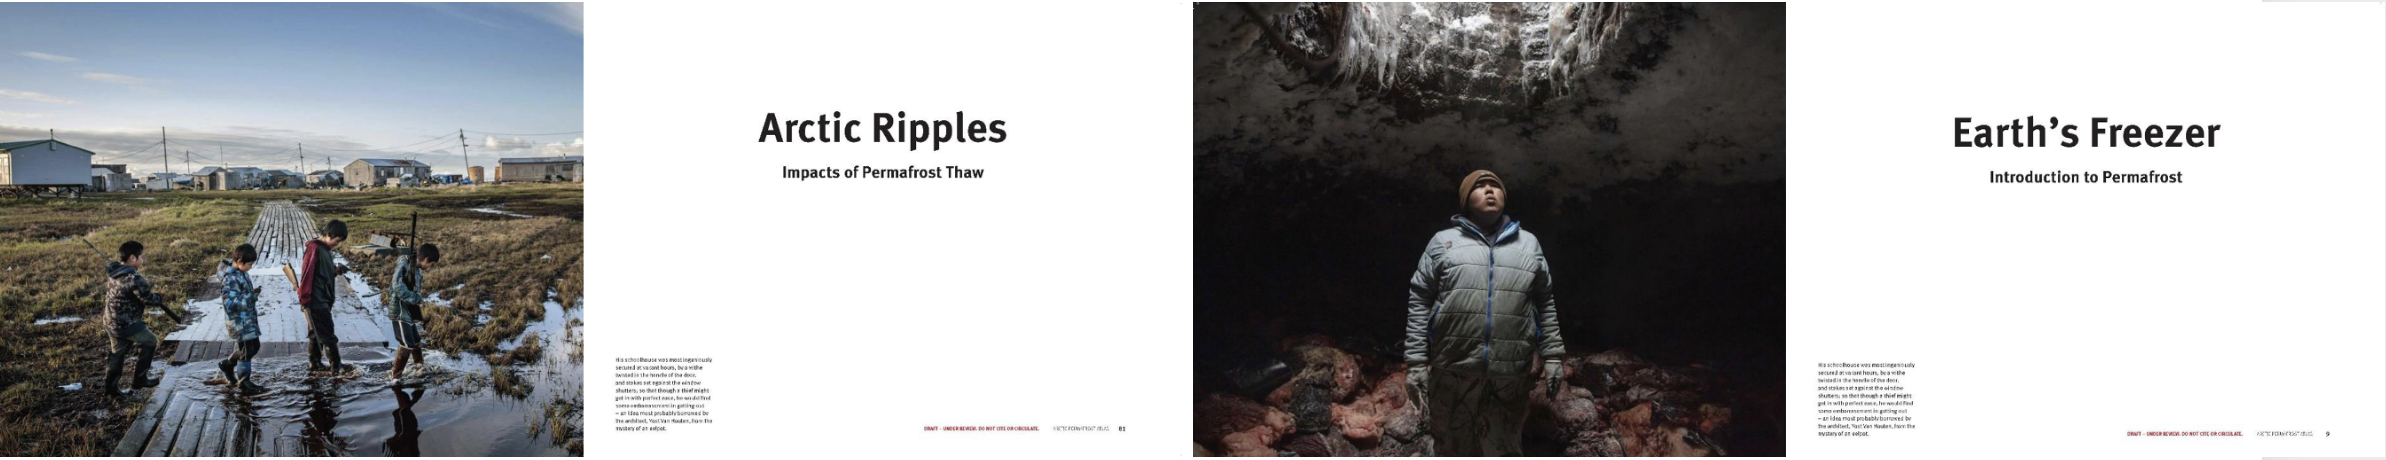
In order to further make the scientific information easily accessible to general public, text is kept to minimum within the chapters while the largest part of the publication is maps and graphics that compile the sometimes complex information into a form that does not require scientific background to be understood.
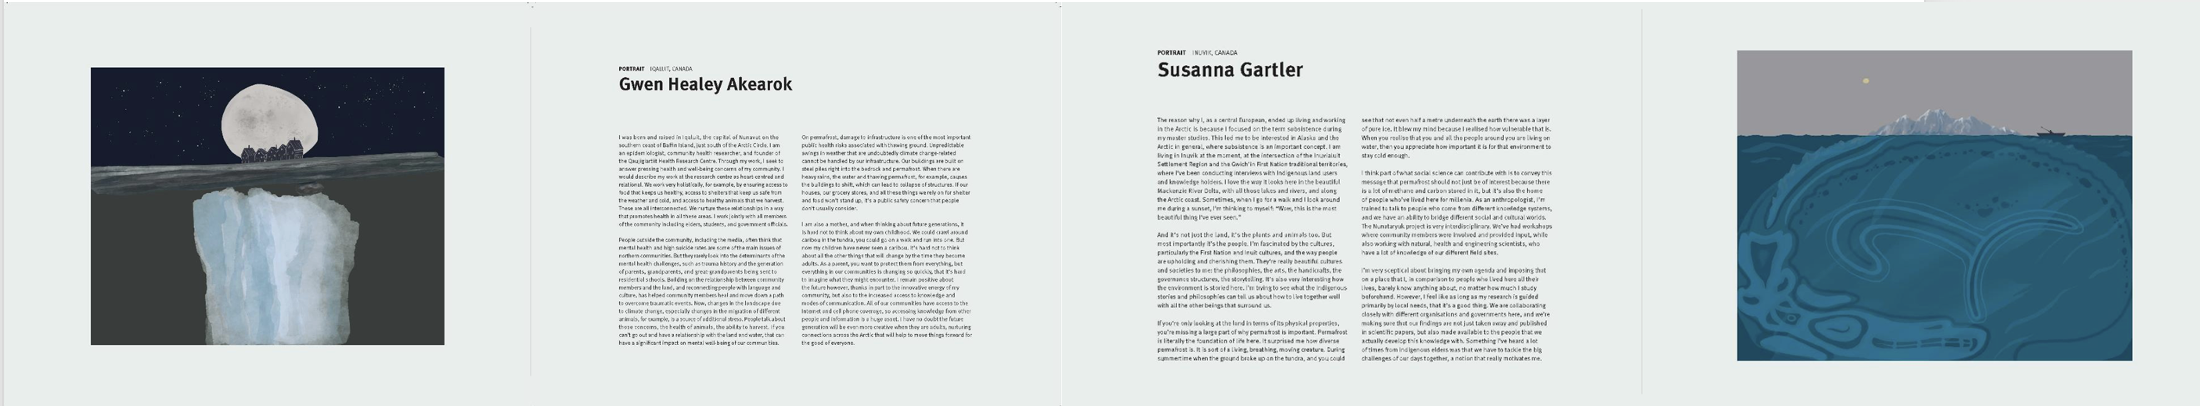
To give the atlas also a human dimension, 9 portrait interwies of people either living or working on permafrost have been included. These portairts build on the special relationship each of the interviewees have with permafrost and how it impacts their day-to-day life and work in the North. Instead of photographs of the interviewees, the portraits are accompanied with unique art pieces by Russian indigenous artist Oluko Borjon-Privé. She has created the art based on the interview texts and explains in the end of the atlas what each of the portrait story made her think and how she envisioned the story in her head that eventually became the image for that story.
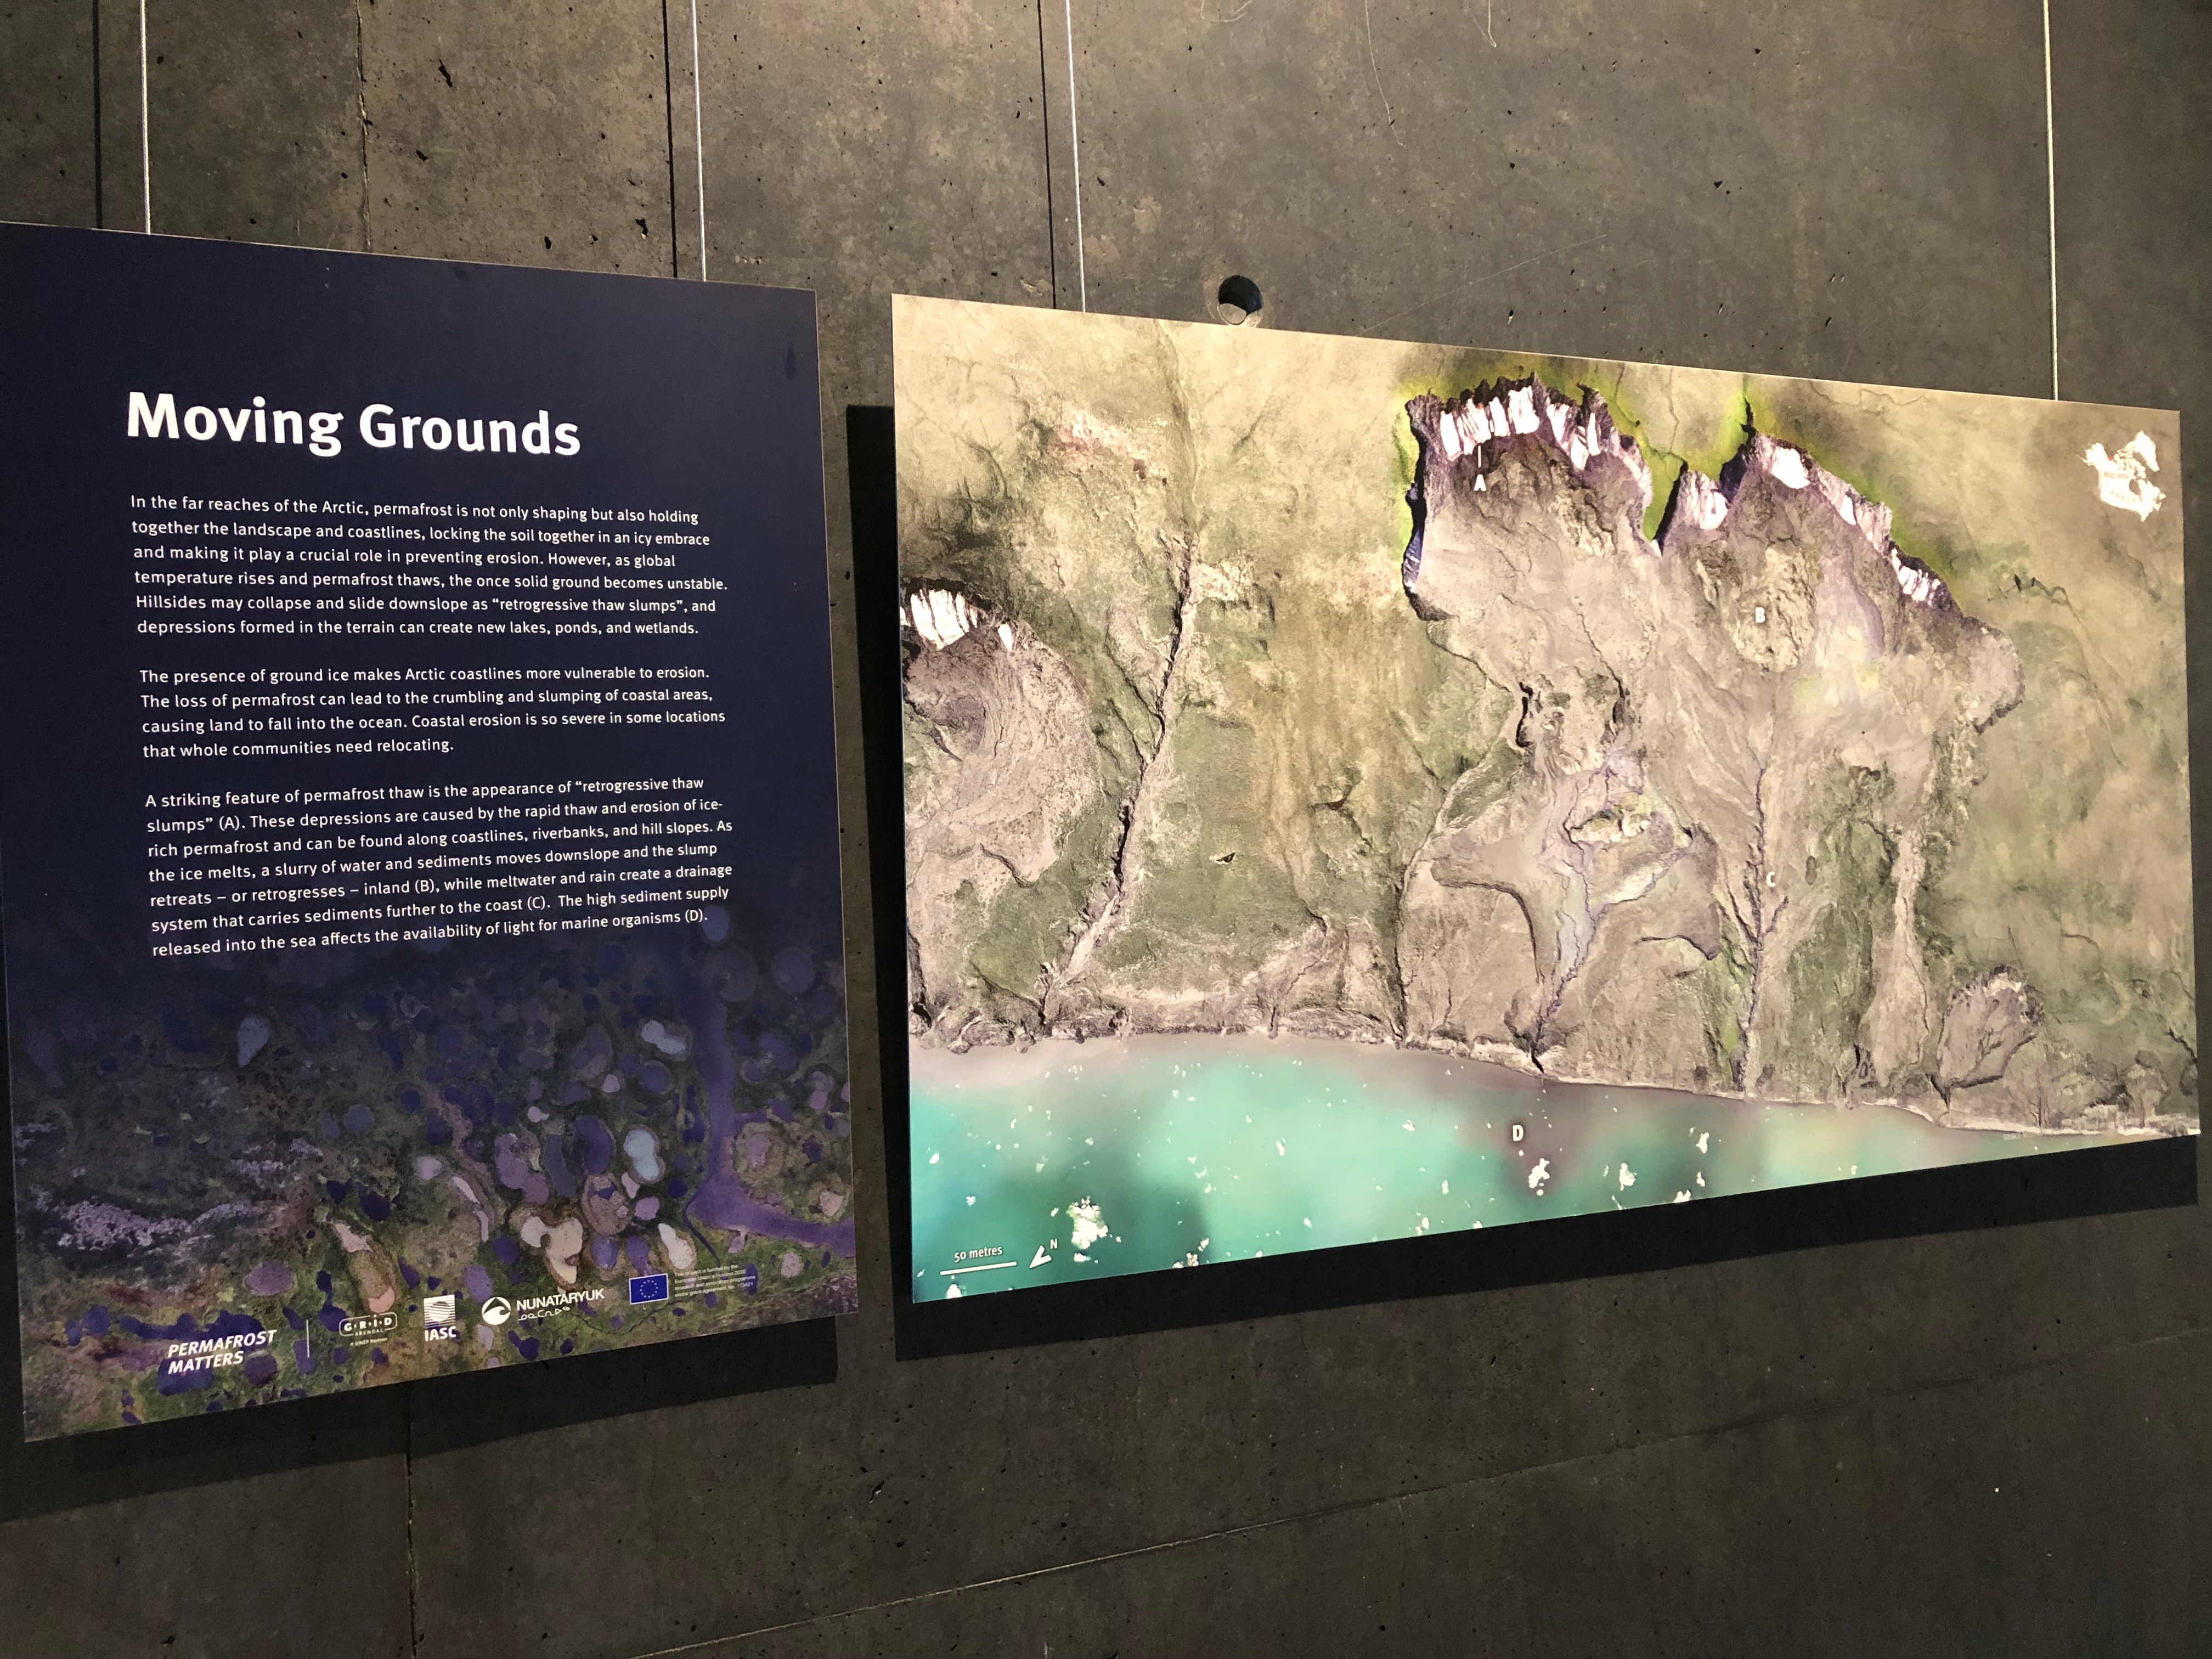
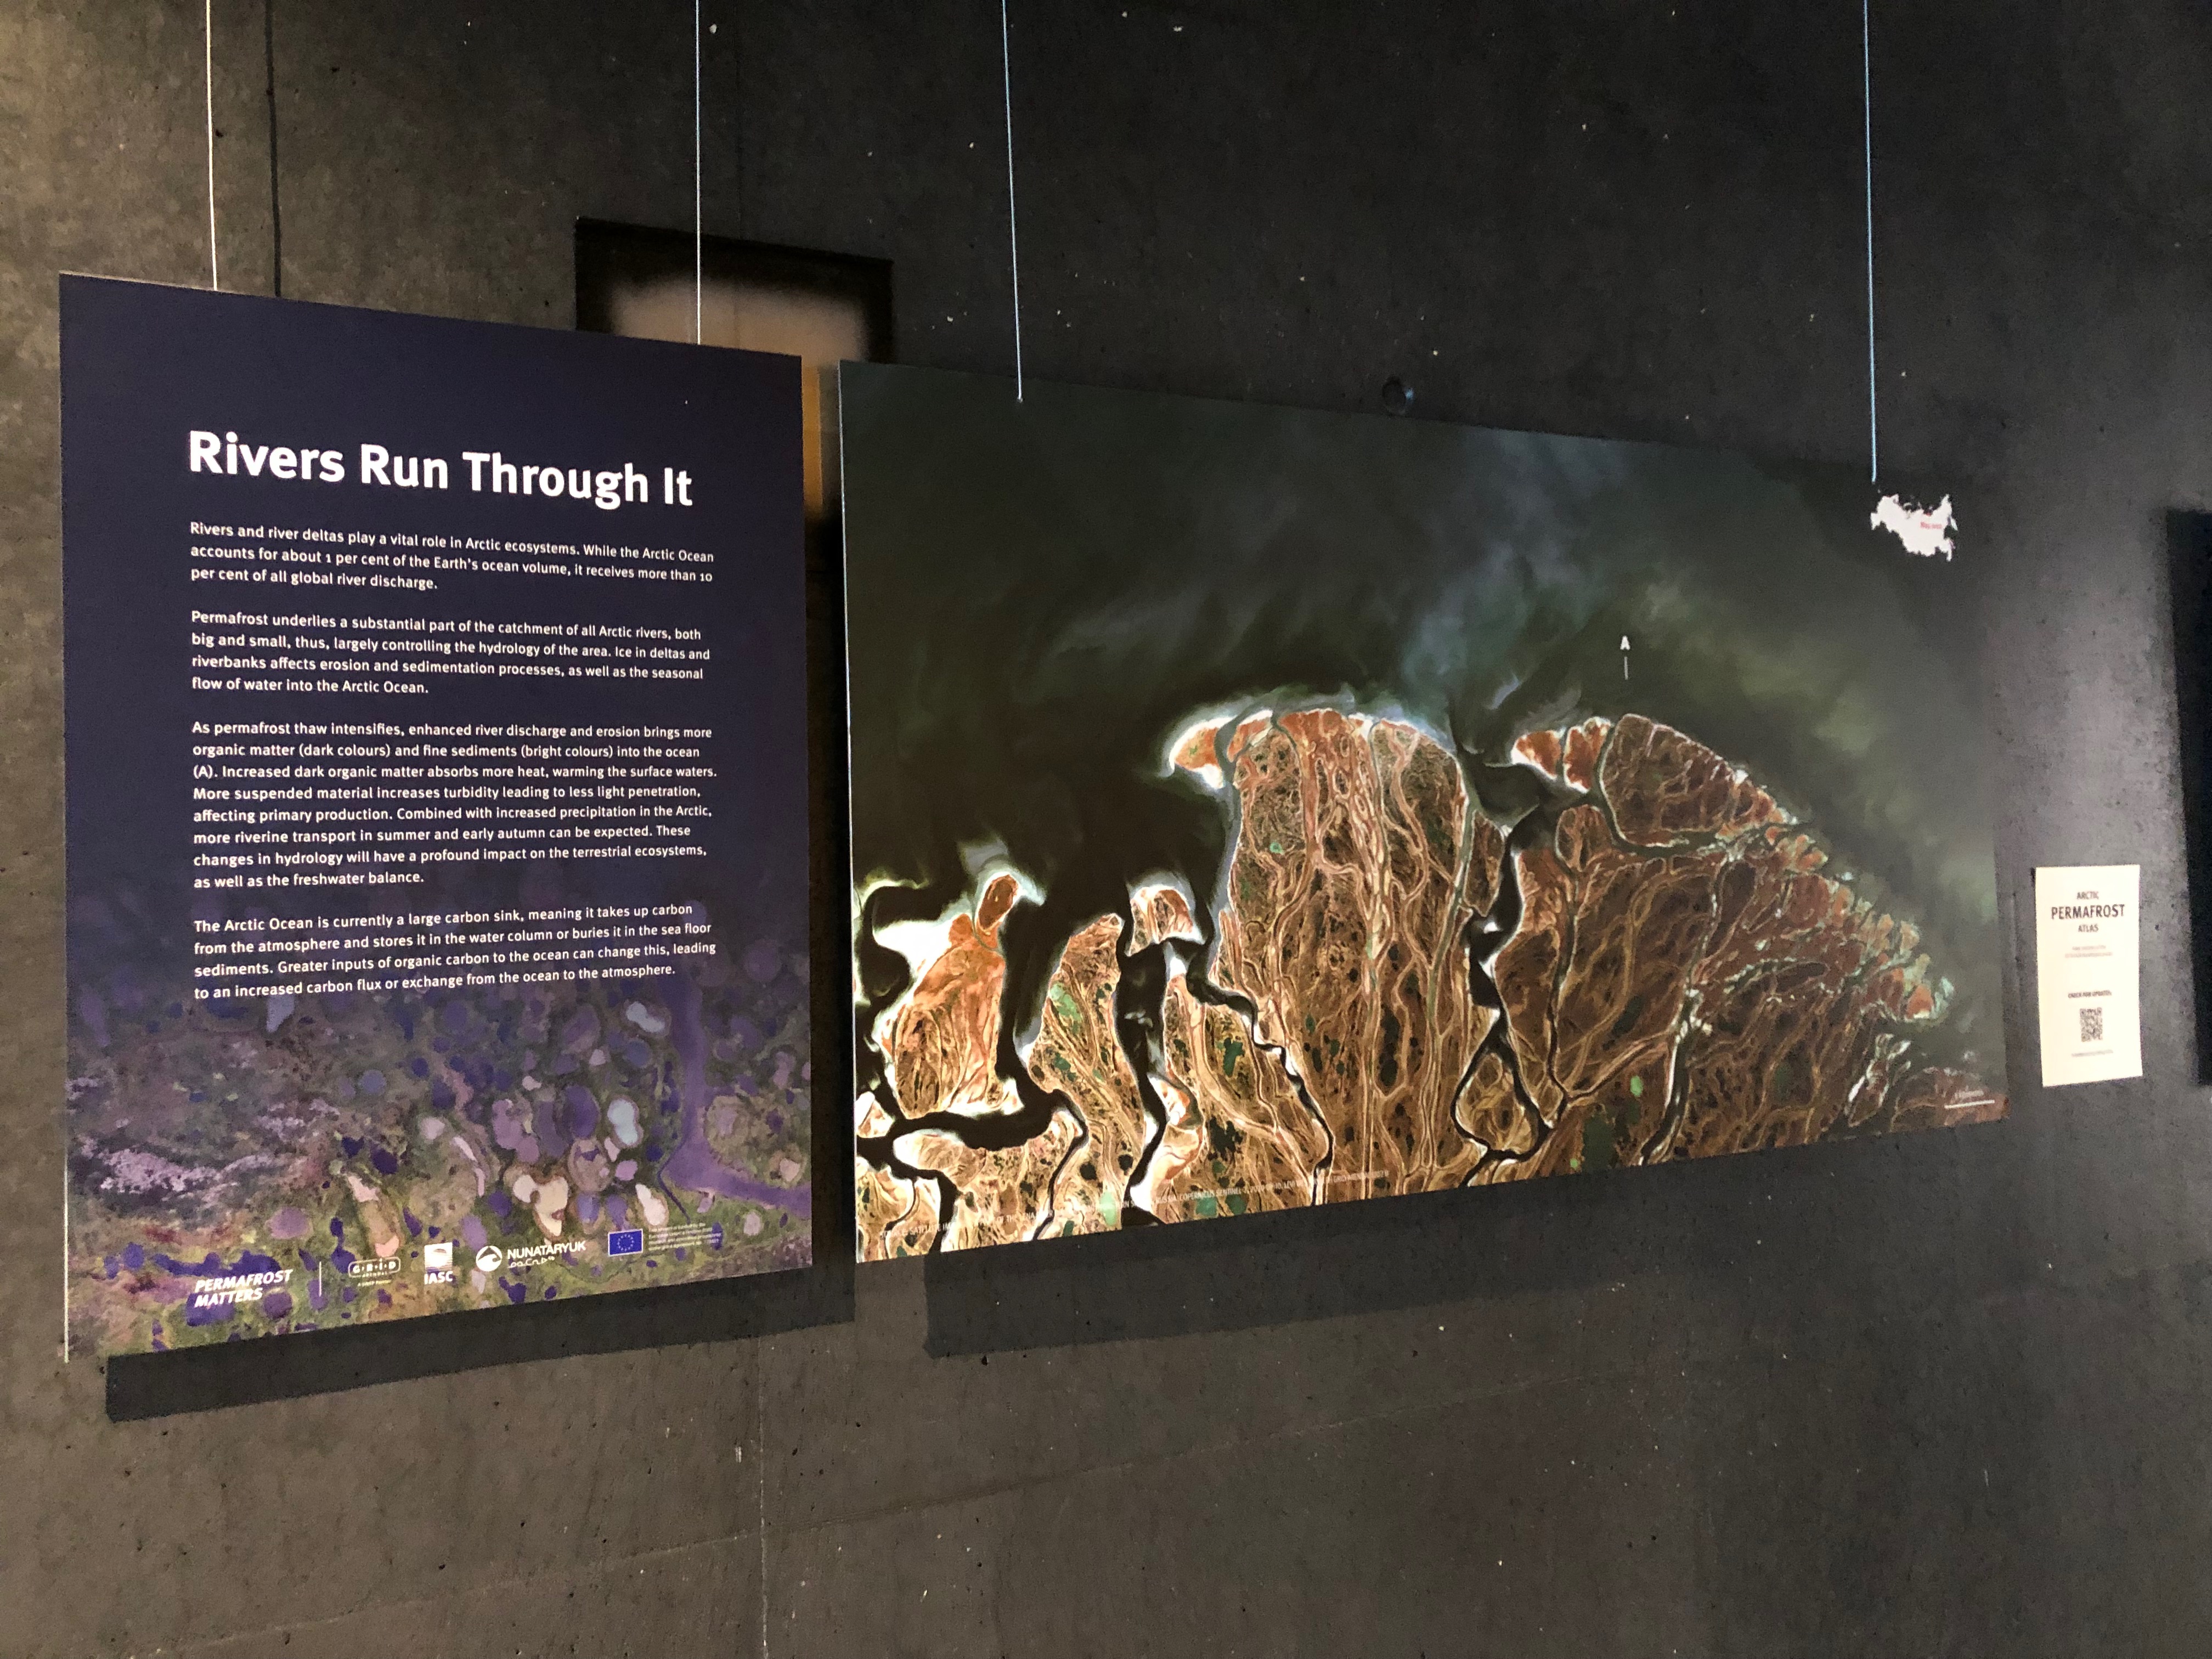
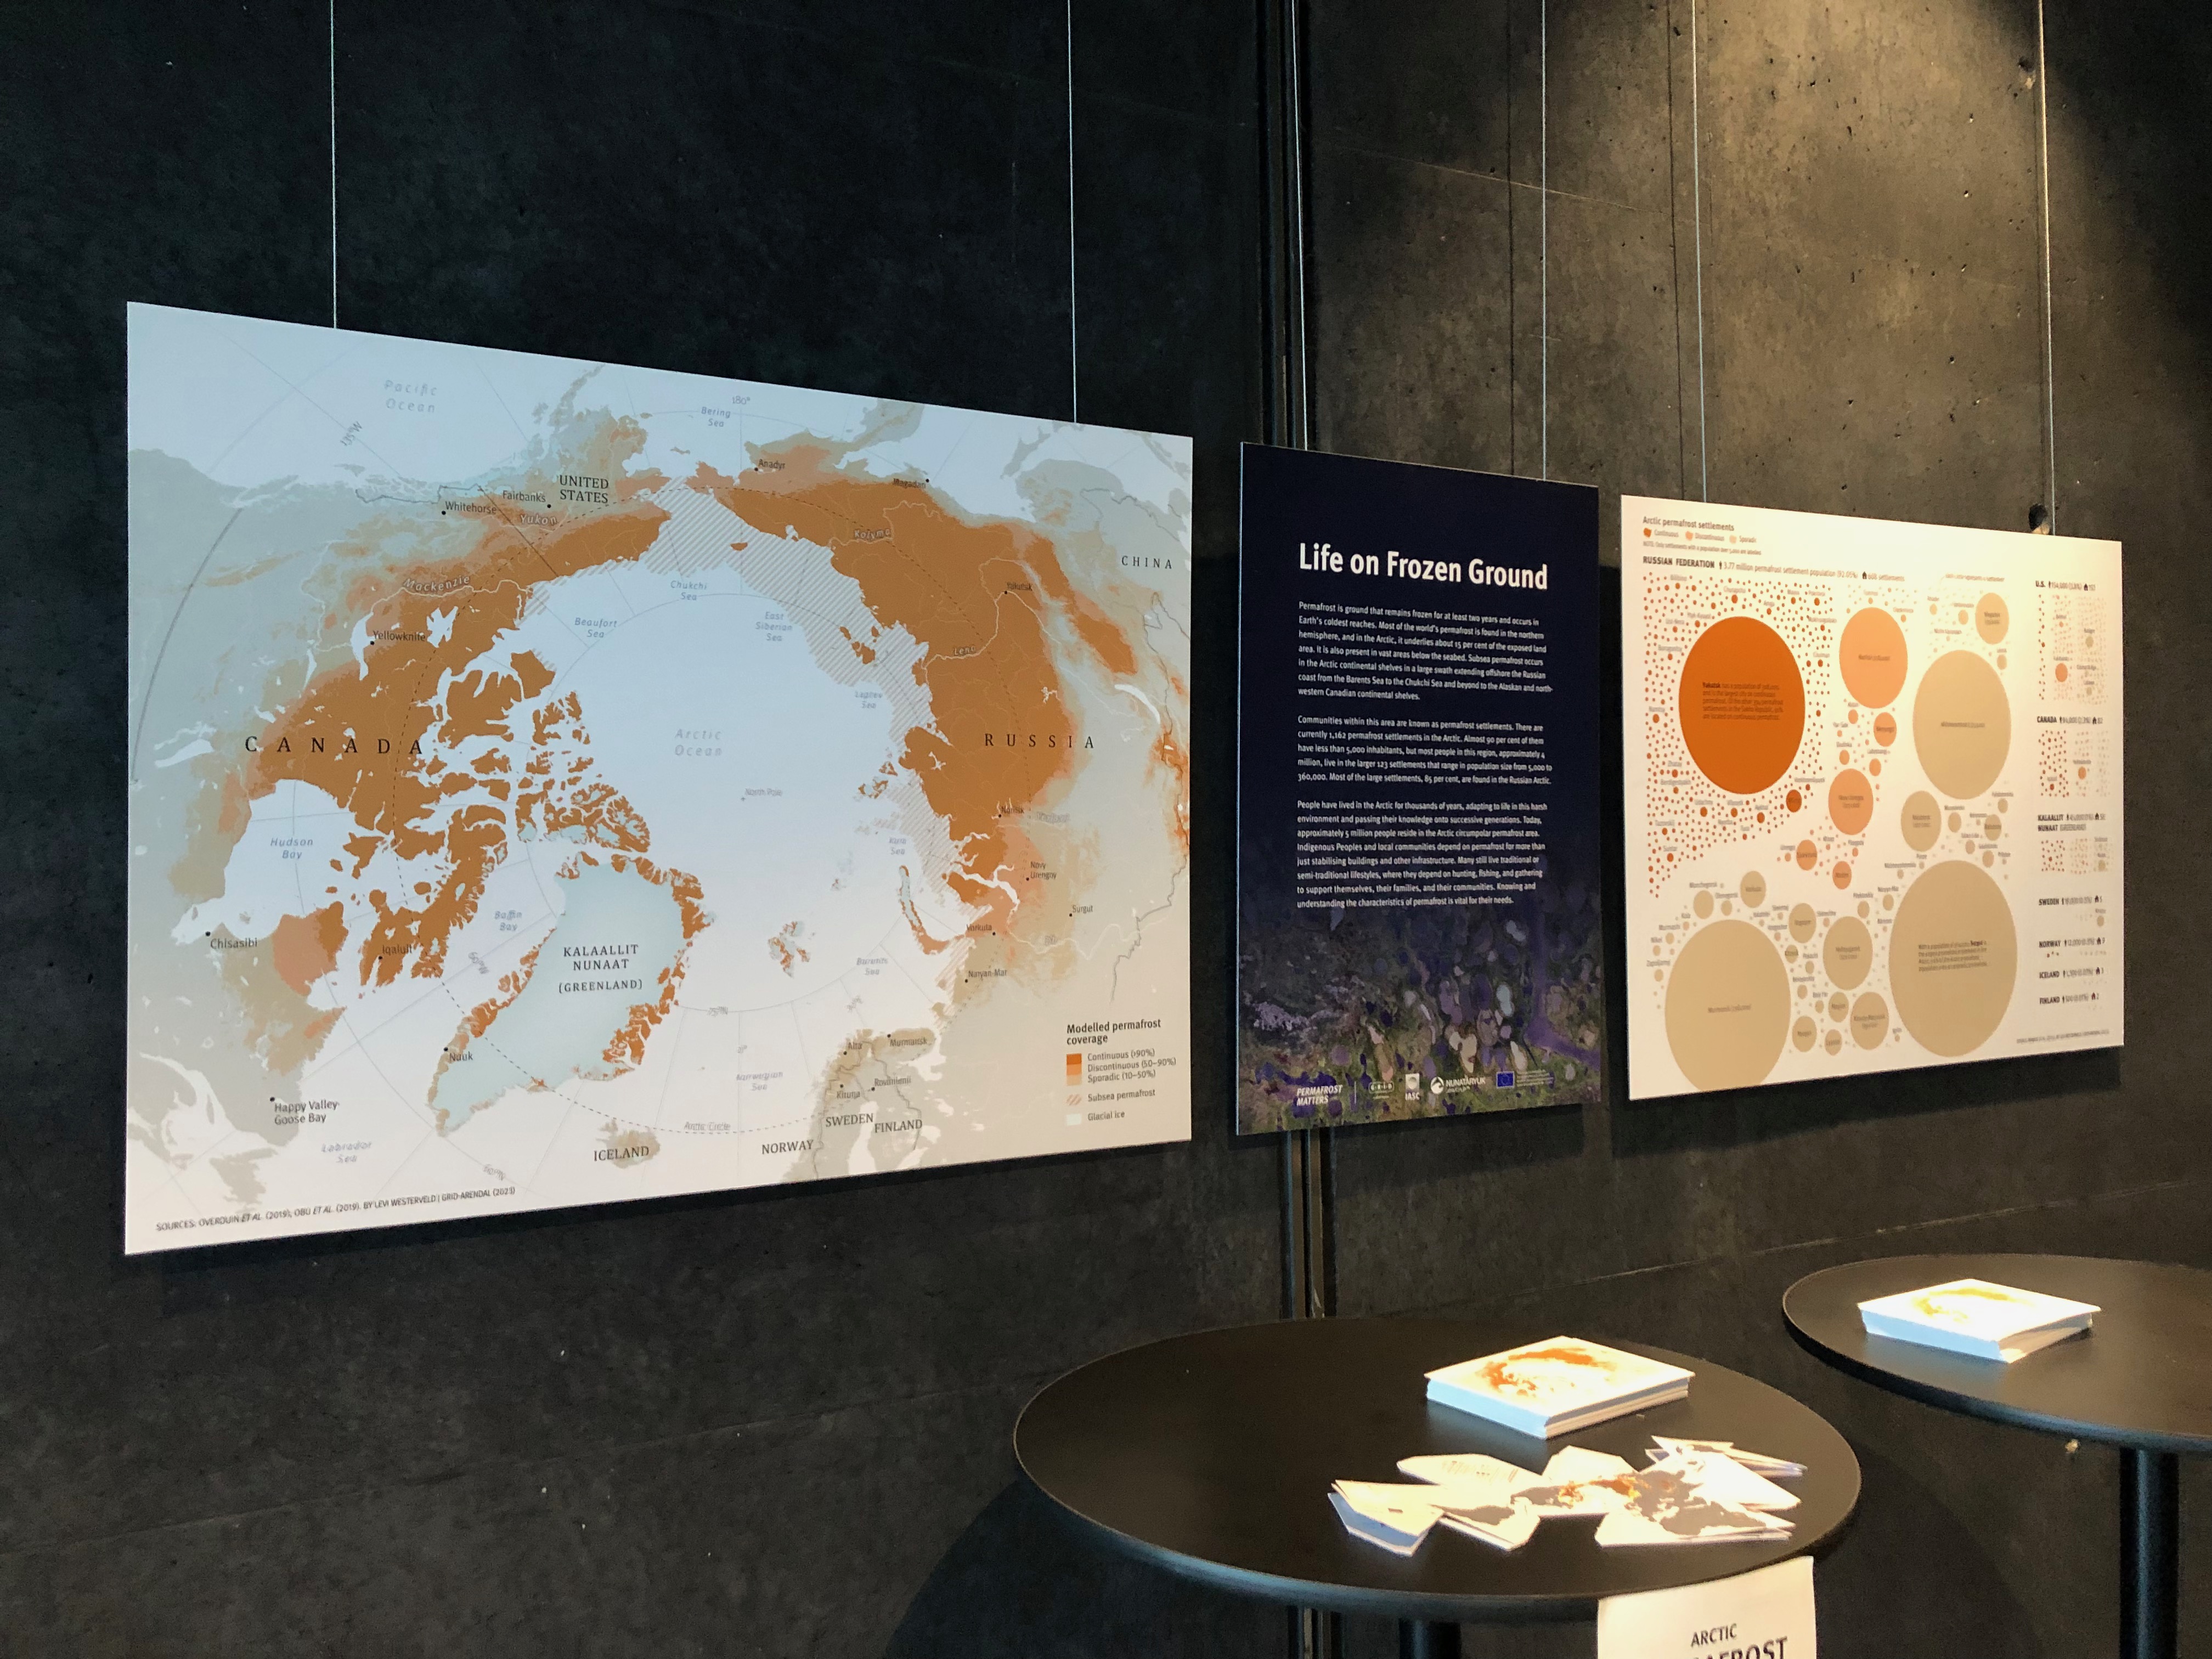
"Permafrost matters" Exhibition
The atlas was launched at the Arctic Circle Assembly in Reykjavik, Iceland 20.10.2023 in conjunction with an Exhibition that was set up in collaboration with the International Arctic Science Committee. The exhibition offered a glimpse into the changing world of permafrost, drawing from the stories, maps, and graphics presented in the Arctic Permafrost Atlas.