The Nunataryuk Communication Plan has at its core a storytelling approach. This is because most people understand the world through anecdotes and stories, rather than statistics. But what do we do when the anecdotes and stories get so complex or extensive that even with text that is extremely well written the message gets lost?
In those cases maps can help in grasping the complexity. A map can be so much more than a way to show locations and data. A map can change our perception of events – reshaping our collective memories of those in the past, describe the ones we are living through in the present, or even spur us into action before we reach the hypothetical future.
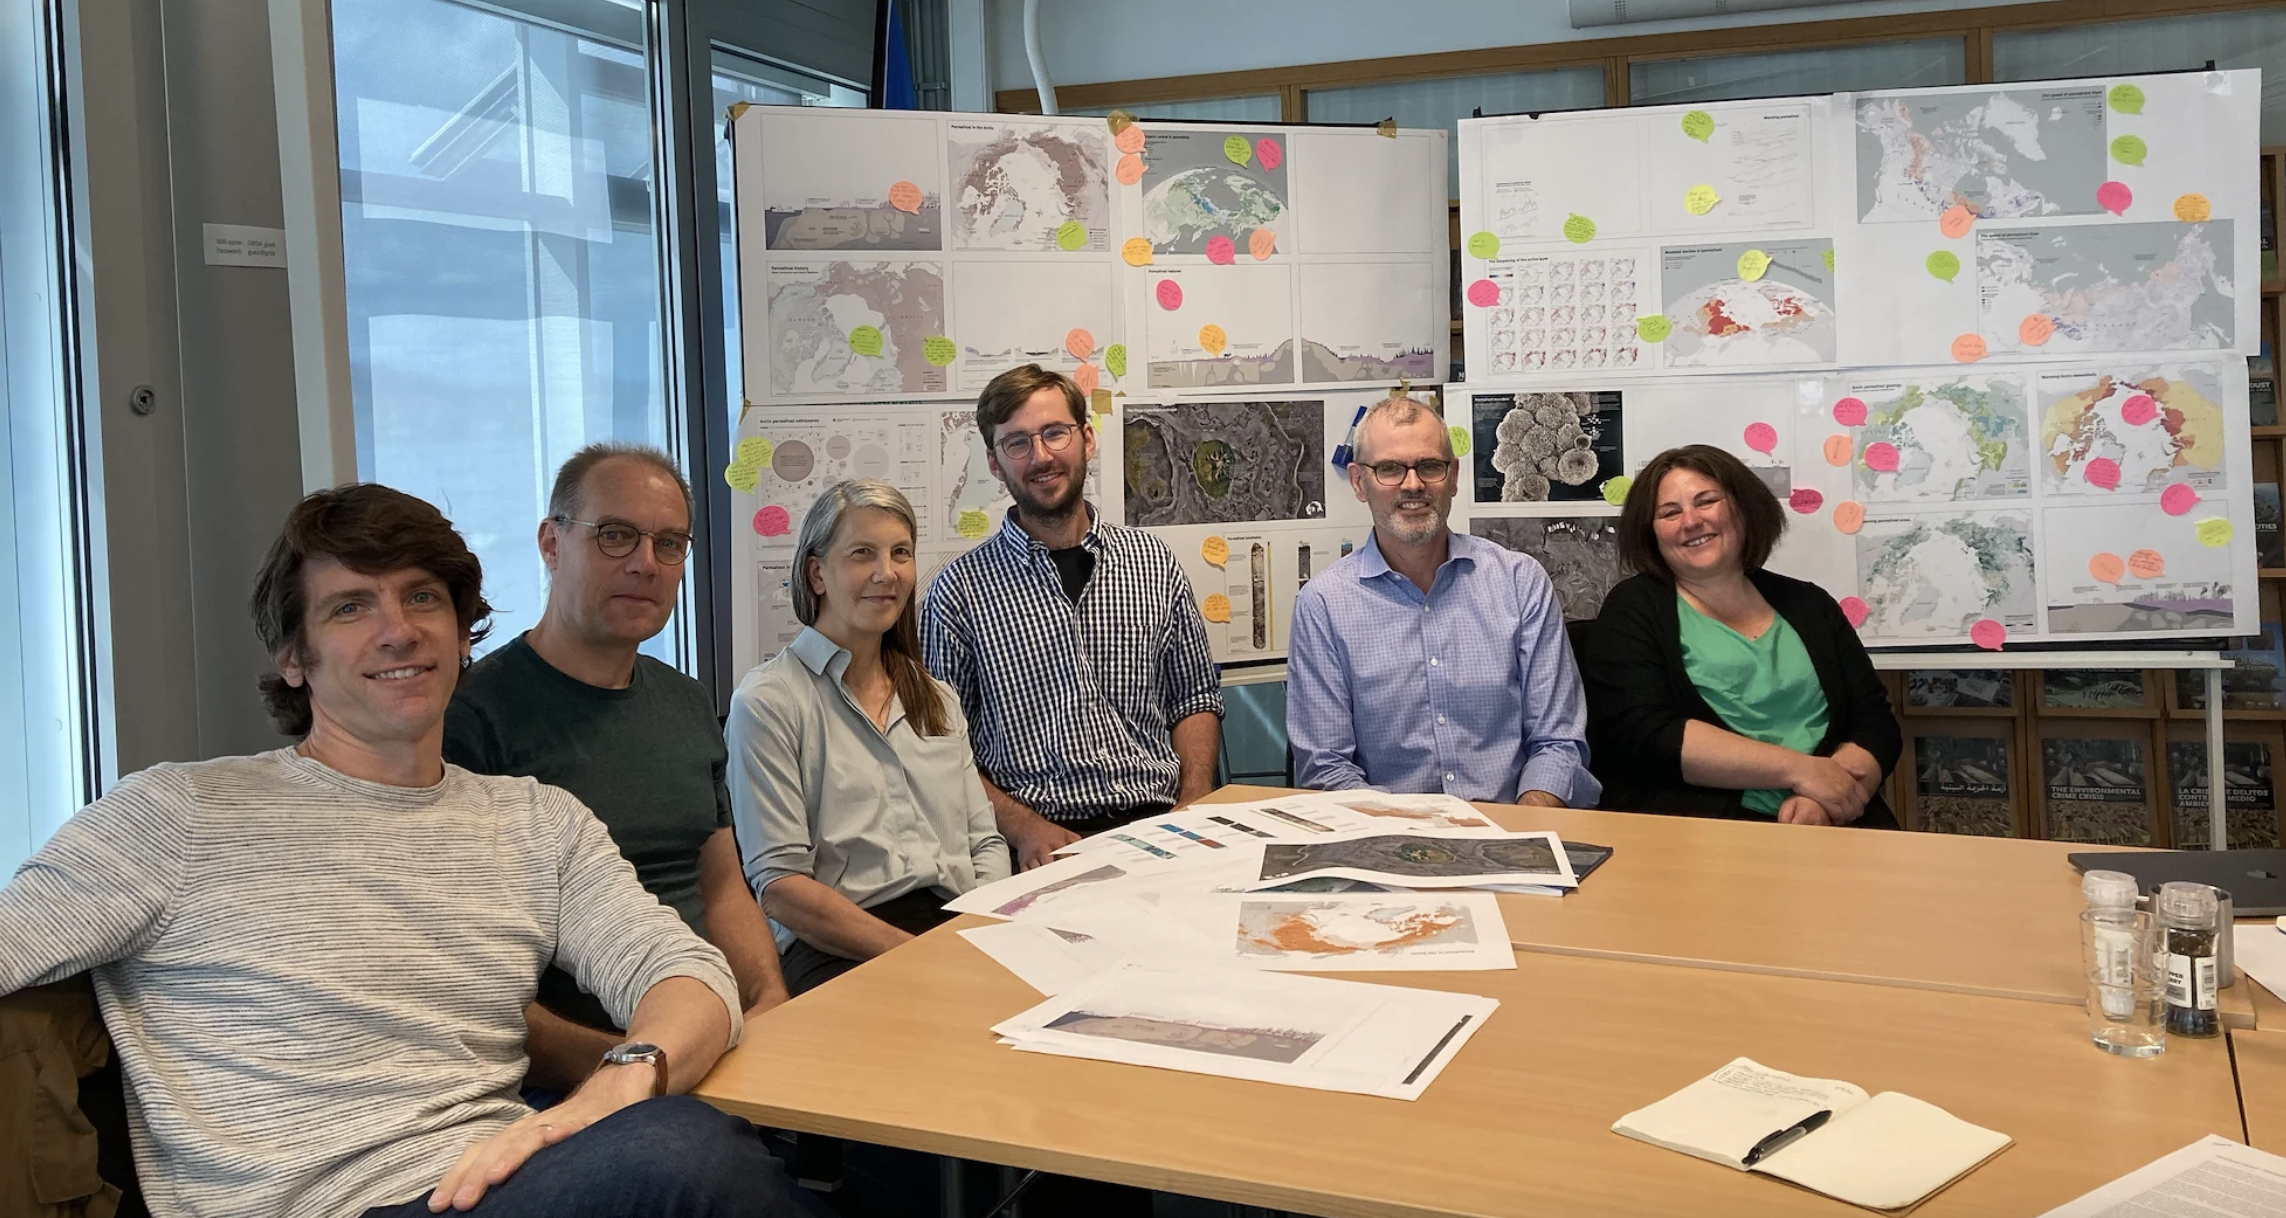
As the main output of the Nunataryuk project, Grid Arendal, together with all Nunataryuk project partners, is creating a state-of-the-art atlas on the knowledge about permafrost and the impacts of permafrost thaw on human communities in the Arctic. During a sunny week early in the summer 2022, the Nunataryuk Permafrost Atlas Advisory Board for Cartography and Design, composed of Alex Tait, Oliver Uberti, and Margaret Pearce, gathered in Arendal to ponder over the maps created for the permafrost atlas.
Read the full story on what the experts say about maps and cartography as a tool to visualize science and other complex issues in the article on Grid Arendal webiste here.